As of June 23, 2025, spot gold is changing hands in the $3,350–$3,400 per ounce range—a continuation of its remarkable rally in 2025. According to Business Insider and Fortune, the price recently moved from approximately $3,362 to $3,353/oz within a day. Earlier in mid-June, JM Bullion reported a surge above $3,400 on the back of geopolitical tensions and softer U.S. inflation.
This surge pushes past psychological barriers, reinforcing a strong bullish trend. As of June 18, DailyForex flagged strong support levels between $3,260–$3,340, with immediate resistance at $3,410–$3,465.
2. Key Drivers Behind Today’s Gold Prices
🕊️ Geopolitical Risk
Conflict in the Middle East—especially escalating tensions between Israel and Iran—is fueling safe-haven gold demand. Markets react strongly to rising oil risk and potential supply shocks, which in turn spur gold purchases as a hedge.
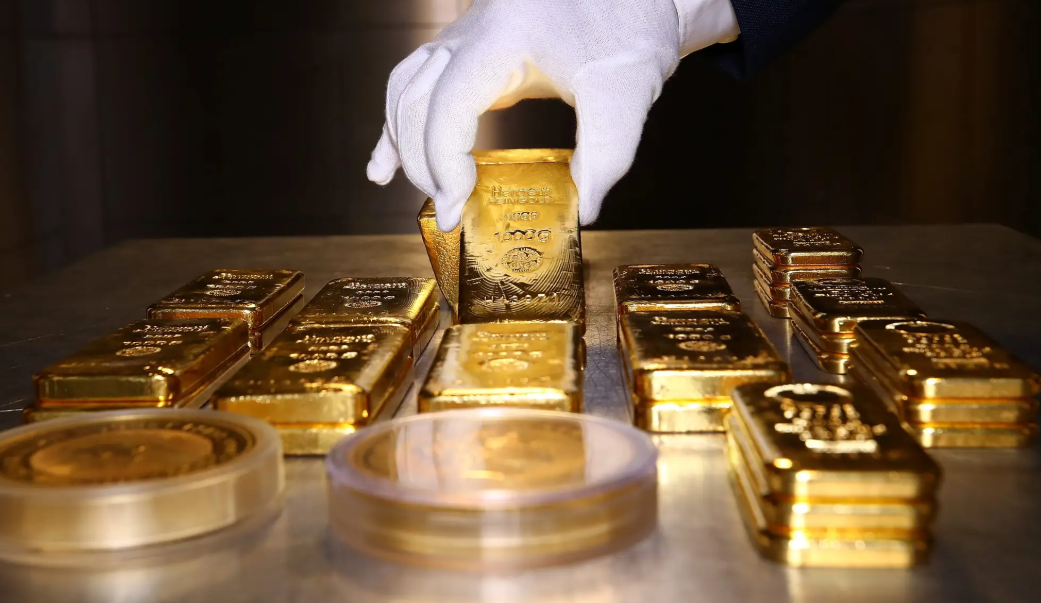
💵 Central Bank Activity
A major catalyst is the persistent gold-buying spree by central banks. In 2024, they purchased over 1,000 tonnes—about double the decade’s average—and China alone added 1.9 tonnes in May, raising its reserves to roughly 2,296 tonnes
📉 Inflation & Interest Rates
Gold thrives in low-rate environments. Recent inflation softening and growing bets on a Federal Reserve pivot are weakening the dollar and boosting bullion demand.
🌏 Trade & Currency Factors
Continuing U.S. tariffs, ongoing trade uncertainty, and a weakening dollar versus global peers spotlight gold as an alternative asset.
3. Market Structure: OTC, Futures & ETFs
OTC & Futures: The London OTC market remains dominant, with the LBMA serving as the industry standard-bearer. OTC transactions, including the twice-daily “London Fix,” and futures (primarily COMEX), establish global reference prices.
Liquidity & Volume: According to the World Gold Council, daily global trading volumes—across OTC, exchange, and ETF markets—are comparable to major equity markets, supporting gold’s reputation as a liquid and tradable asset.
ETFs: Gold-backed ETFs are pivotal in modern bullion trading. In early 2025, U.S. investor inflows were robust, while Chinese gold ETF assets dipped due to seasonal outflows in May.
4. Regional Trends & Physical Demand
🐲 China
May saw a decline in withdrawals via the Shanghai Gold Exchange (~99 tonnes, –35% month-on-month), largely seasonal.
China’s PBoC continued to accumulate bullion.
Early-year ETF distribution faced minor outflows, attributed to shifting sentiment in U.S.–China trade rhetoric.
🛒 Western Retail
High-street outlets and bullion retailers, including Costco, reported surging interest: a one‑ounce bar bought in 2024 at $2,399 is now worth ~$3,390—a ~41% gain.
However, sellers can face 5–10% markdowns compared to spot, and in the U.S., gold is taxed as a collectible at up to 28% on gains.
Greetings from Dubai: Local refiner Emirates Gold, listed on the UAE Good Delivery roster, leads physical bullion availability across the Middle East.
5. Market Outlook & Trading Strategies
📈 Bullish Viewpoints
SSGA projects this “new normal” zone to be $3,100–$3,500 in 2025. Their bull case (30% probability): prices may climb to $4,000 within 6–9 months amid stagflation and de-dollarization.
Bank of America and SocGen envision highs around $3,500–$4,000+.
⚠️ Bearish Forecasts
Citi anticipates a mid‑2025 pullback below $3,000–$2,800 by early 2026.
Citigroup warns of a 25% downturn to $2,500–$2,700 if economies stabilize.
🧠 Trading Tactics
“Sell the rallies” has become a common theme—capitalizing on minor upswings ahead of expected Fed rate cuts.
Technical analysis suggests strong support near $3,260–$3,340 and resistance at $3,410–$3,465.
6. What Traders Should Know Today
- Diversified Exposure: Consider exposure across physical bullion, ETFs, futures/options, and central-bank flows.
- Tax Efficiency: Physical gold involves premiums/discounts and taxable gains—state, country, and product purity matter.
- Geopolitical Monitoring: Keep an eye on developments in the Middle East, trade deals, and central bank meetings (e.g., Fed forecasts).
- Seasonality Awareness: Midyear often sees weaker physical demand in Asia—watch for seasonal dips before building inventory.
- Liquidity Remains Strong: High volumes across OTC, futures, and ETFs mean institutional traders can enter/exit with tight spreads.
🔍 Summary: Today’s Trading Framework
- Price Range: ~$3,350–$3,400/oz, fluctuating with intraday news.
- Drivers: Geopolitics, inflation expectations, central-bank bullion, and interest-rate forecasts.
- Structure: Robust international liquidity, supported by OTC, futures, and ETF ecosystems.
- Outlook: Near-term consolidation in the low $3,300s; strategic upside scenarios may reach $4,000+, while normalization could retrench to $2,800–$3,000.
- Trading Tips: Blend risk management, diversify instruments, monitor macro calendars, and capitalize on seasonal trends.
Conclusion:
Today’s gold bullion market is a complex mosaic of macro fears, central-bank buying, and structural liquidity, making it a fertile ground for traders and investors alike. Whether you’re speculating on short-term swings or positioning for long-term trends, staying informed and agile is essential.